Lighting Page Performance – How to Identify Performance Degradation
The amount of time it takes for a page to load has a direct impact in the perception and adoption of an application. That is why it is very important to identify if there are any performance issues as quickly as possible. There are multiple ways in order to identify if there is a performance degradation some are more complex than others. This article will focus on a report that any one can create and setup in less than 15 minutes.
In the Winter ’19 release, Salesforce launched the Lightning Usage App, along with the app several objects were created that can be used in a custom report type. We will be focusing on one, in particular, the LightningUsageByPageMetrics. This object measures the EPT or Experience Page Time for standard pages users viewed most frequently. The object records are created once per day as an aggregate for the day before. Records are created if the page has been loaded the previous day.
With the help of 2 formulas, we will be able to use this report to send an email as an alert if EPT performance falls below a given threshold(for the purpose of this demo we will be using a threshold of a load time greater than 2 seconds speed and combined 5 percent). First, we will create a custom report type, then 2 formulas in a report, subscribe to the report.
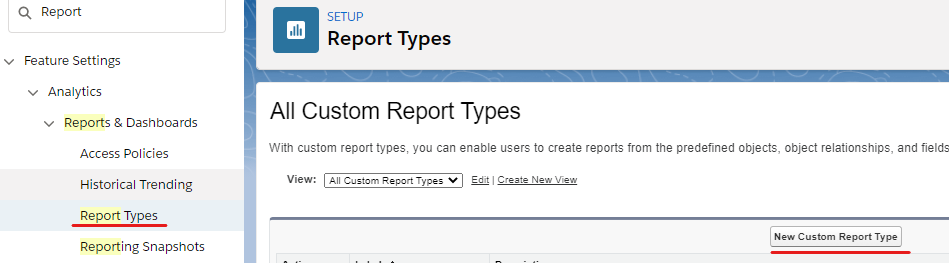
Create a custom report type; go to Setup –> Report Type –> New Custom Report Type:
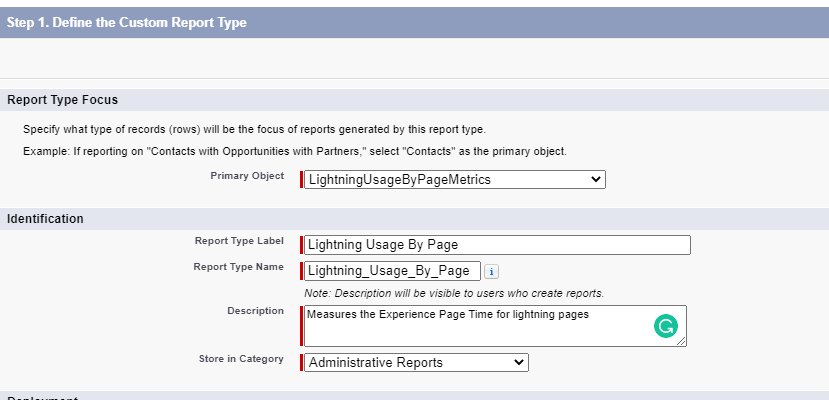
Select the LightningUsageByPageMetrics object and fill in the remaining fields for the report type, then save.
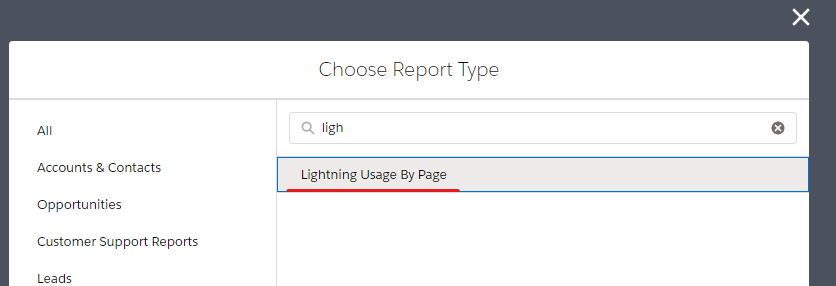
After the report type has been saved go to the reports tab –> New Report –> find the new report type:
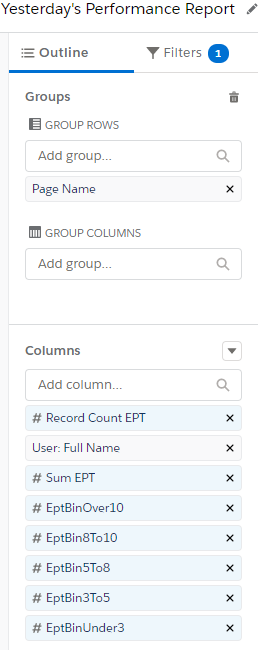
In the report add as many or as few fields as you would like, I would add them all just to get familiar with them. Group by ‘Page Name’.
Create 2 summary percent formulas: Performance Degradation(summary level). This will measure the percentage of pages of times each given page load speed is greater than 2 seconds, for each page:
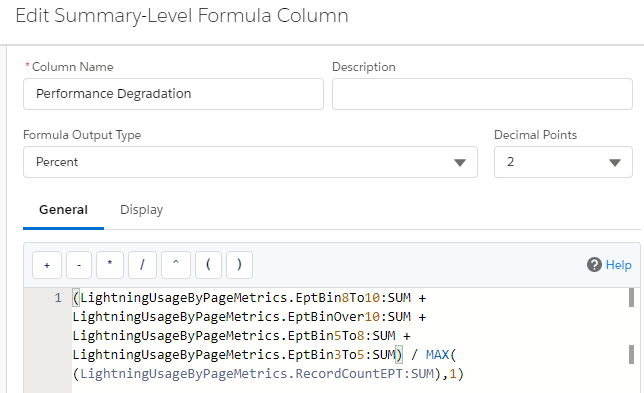
(LightningUsageByPageMetrics.EptBin8To10:SUM +
 LightningUsageByPageMetrics.EptBinOver10:SUM +
LightningUsageByPageMetrics.EptBin5To8:SUM +
LightningUsageByPageMetrics.EptBin3To5:SUM) /
MAX((LightningUsageByPageMetrics.RecordCountEPT:SUM),1)
Then create the Composite Degradation (grand total only). This will compile the total percentage of page load speeds greater than 2 seconds:
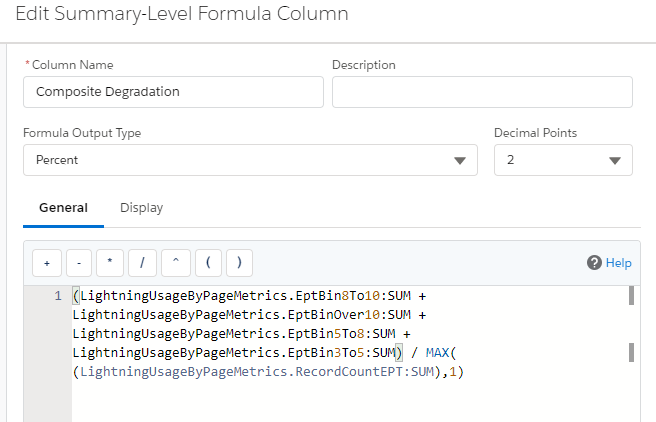
(LightningUsageByPageMetrics.EptBin8To10:SUM +
LightningUsageByPageMetrics.EptBinOver10:SUM +
LightningUsageByPageMetrics.EptBin5To8:SUM +
LightningUsageByPageMetrics.EptBin3To5:SUM) /
MAX((LightningUsageByPageMetrics.RecordCountEPT:SUM),1)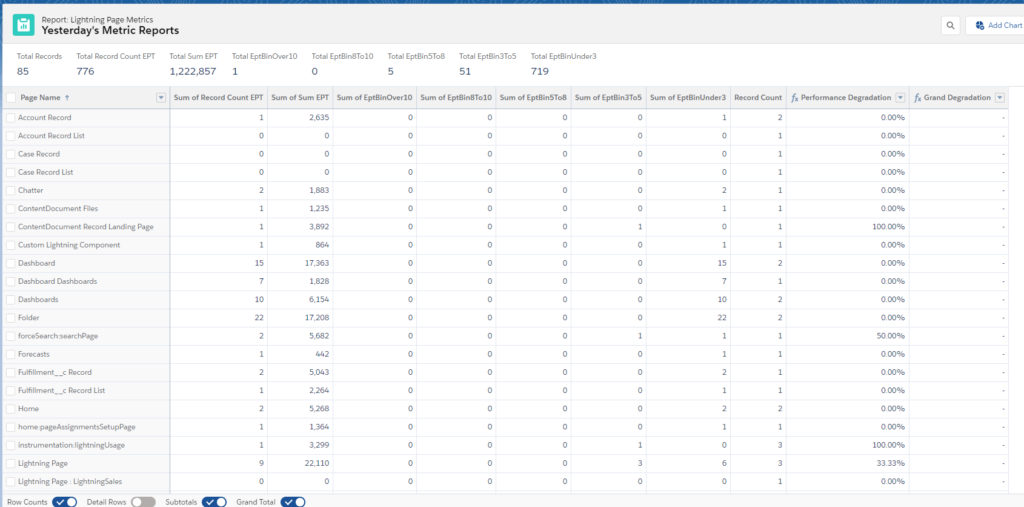
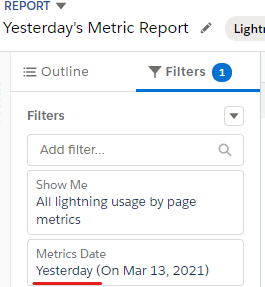
Next change the filter for Metrics Date to Yesterday (remember records are only created once a day and for the previous day)
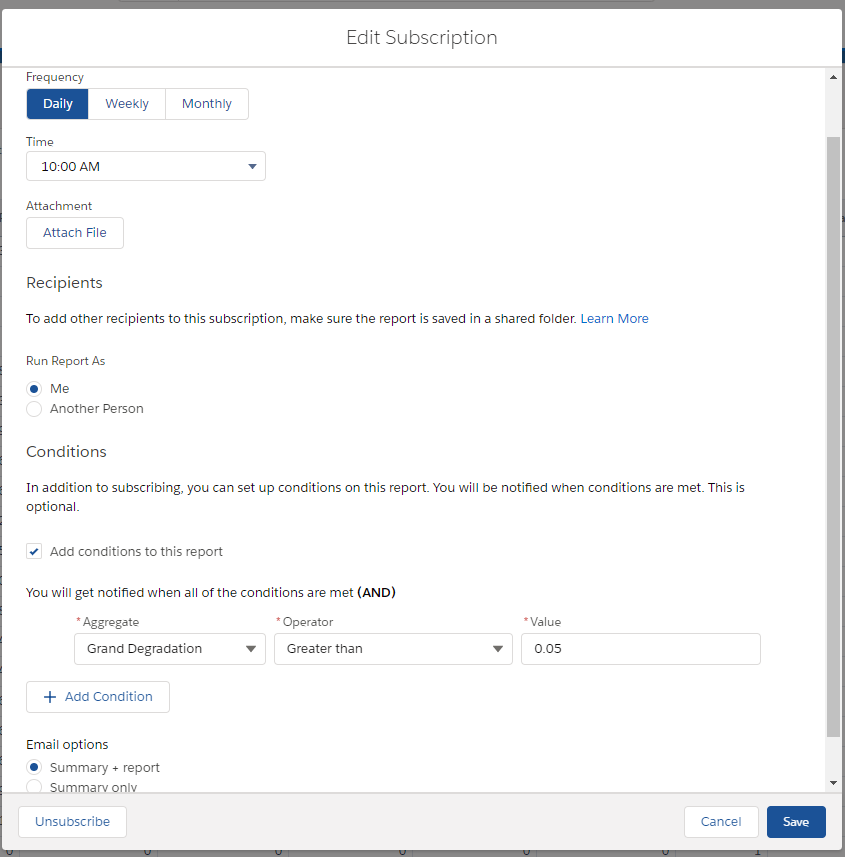
Finally subscribe daily with a condition to send when the grand degradation is greater than 0.05.
After creating this report you can change the formula to track a different set of speeds, ex. if you only wanted greater than 5 seconds remove ‘LightningUsageByPageMetrics.EptBin3To5:SUM’ from the formulas. If you wanted to focus on specific pages add them to the filter or change the report condition, customizing to what your users need. This report can be a useful way of proactively identifying which pages may be causing users trouble without having to actively remember to look at a specific page or report.
Checkout My New Course:
Crush It As A Salesforce Developer: Mastering Apex

Test Your Knowledge:
Try the new Salesforce Developer Quiz
2 comments on “Lighting Page Performance – How to Identify Performance Degradation”
When a user accesses a host instance from a different geographical location, it can also cause slow performance. Latency issues between remotely located web servers and the client device or any issue within the network can degrade the performance of Salesforce. Virtual private networks that need routing through a data center before rerouting to a Salesforce instance can be a reason for increased latency.
I have not had to deal with that issue before. Thank you for bringing it up!