Increase your Debugging Skills – Salesforce Apex Debug Logs
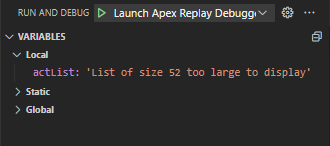
Debugging Apex in Salesforce Apex logs can be difficult. If you have downloaded an apex log and tried to find the issue it can be a big chore. With Visual Studio Code and the Apex Replay Debugger extension debugging has become much easier. This article won’t be going through Apex Replay Debugger as trailhead has a very good module on it. However as good as the replay debugger is it is only as good as the Apex log itself. If you are trying to view a large string, object, list, etc.. the results may be truncated. Such as below:
Debug Apex Logs
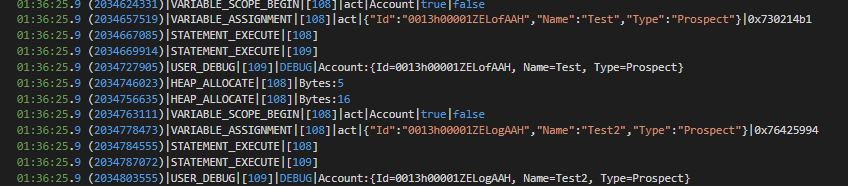
Knowing that the Apex Replay Debugger will not display a large list the list could be debugged such as below where the logs show more detail, however still truncate at some point.

The list could go into a for loop and debug each list item such as below
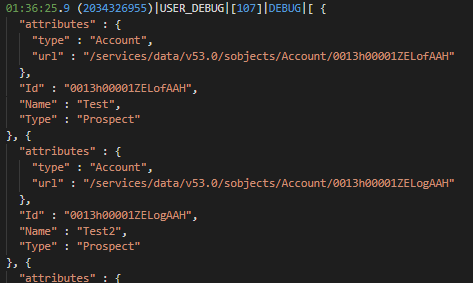
Or the list could be debugged with the following:
System.debug(JSON.serializePretty(object));The above line of code will display the full list, plus additional metadata not shown in the for loop. This method is also a great way to debug other large objects. As an example, if you are making a REST callout and don’t know the full payload.
There are multiple ways were using the Apex Replay Debugger along with System.debug() can be used with an Apex Log to create a full picture of what is happening within a transaction. However my preferred approach is to use System.debug(JSON.serializePretty(object)); to debug an Apex log.
Checkout My New Course:
Crush It As A Salesforce Developer: Mastering Apex

Test Your Knowledge:
Try the new Salesforce Developer Quiz